Introducing GeoCite: Innovating Map Science Communication Through Interactive Platforms
- Samuel Evangelista

- 13 hours ago
- 6 min read
by Samuel Evangelista and Daniel Jann Cotia

We all know maps are used as tools for getting from point A to B. It has been about seeing the world on paper. In the modern times, maps have become a powerful tool that humanity has developed for understanding the world. Doctors use it to track disease outbreaks. Economists use it to map poverty hotspots. Ecologists use it to protect the last surviving habitats in otherwise fragmented landscapes. In architecture and urban planning, maps tell us not just where things are, but why they are the way they are and identify options of improving our built environments.
The problem so far is that most spatial knowledge stay locked behind technical reports and academic papers that a common person wouldn’t be able to immediately understand; furthermore, information is best imagined across different ways of representation; from maps, to statistical graphs to stories experienced by people. Static representation has its limits, thus further requires intent and visual finesse.
We wish to contribute to the evolution of how spatial knowledge is conveyed by allowing users to actively navigate, dissect, and examine data layers themselves.
This is the founding idea behind GeoCite.
Access GeoCite at: wtalabs.ph/geocite

In today’s world, our complex cities and spaces have compelled complex maps.
Maps have advanced to move beyond merely describing space and identifying places. Maps have been illustrating numbers, distribution and change across time scales. Typically, digital cartographic tools (e. g. GIS) have compelled the creation of several maps for one study area; for use cases in urban planning, architecture and science. The limitation arises at cascading these information to the general public. How do we increase public understanding and appreciation for different spatial findings that scientists, planners and architects arrive at? Navigating a multitude of maps in thick documents is both difficult, overwhelming and lacks a way of finding your own locations and spatial experience in those maps.
GeoCite: an interactive web map
GeoCite is an open-access interactive web map platform that helps reorient how we look at comprehensive and complex spatial data. Apart from maps that we include in our research manuscripts, we wanted the readers to be able to learn and appreciate the findings through an interactive platform. We wanted viewers to have more ways of absorbing the concepts: across scales, across study contexts and sub-contexts.
We believe the gap between data and understanding has a design problem; and scientists and planners have a constraint in science communication. While the information is already out there, the continuing challenge is making it intuitive. GeoCite joins the growing movement to make this data navigable, working to transform static maps into living, breathing spatial stories that city planners, barangay officials, students, and residents can actively use in their daily lives.
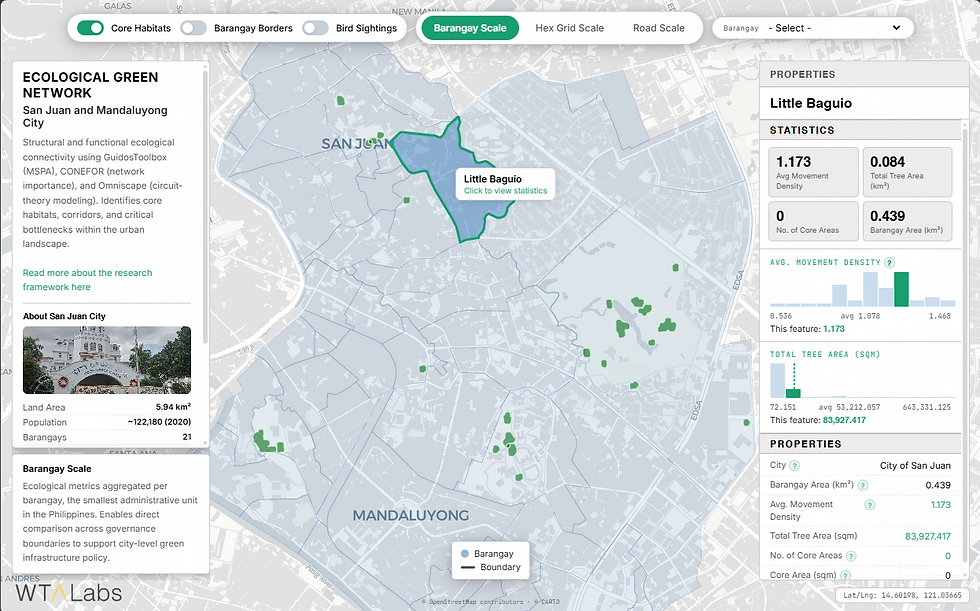
GeoCite’s first featured work is the Ecological Green Network of San Juan and Mandaluyong — a study that maps the hidden wildlife corridors and critical habitat patches of two of Metro Manila's most densely built cities, and asks how connected nature here really is, towards bringing meaningful policy insights for local planners: how do we plan cities that consider wildlife? What streets do we regreen, towards improving the overall ecological green network corridors?
GeoCite’s second featured work is Mapping Schools and Walkability Catchments: Case of Metro Manila, with a focus on education and spatial planning and governance in the Philippines. As the country continues to grapple with an education crisis that reflects from the declining school performances to deteriorating facilities, coupled by a hellish state of urban design and walkability in urban environments. This study maps out the schools in Metro Manila, and estimates the extent of their 15-minute vicinities, conversely identifying areas far from the next schools.
How web maps are built
Making a publication on GeoCite involves a pipeline that moves from raw geographic data all the way through to a polished, publicly accessible interactive experience. The data is cleaned, processed, and structured in GIS environments to answer a specific spatial question and direct to intended spatial narrative. For the Ecological Green Network, this meant mapping every fragment of tree canopy across 17 square kilometres of urban fabric, classifying it morphologically, and modelling how urban birds might realistically move between those fragments. For the School Catchments map, this meant mapping schools, their 15-minute walking catchments and the areas outside them.
The interactive web application that houses each GeoCite publication is built through an AI-assisted development process, as the team is only composed of scientists with little programming backgrounds. WTA Labs uses Claude AI to write the map engine code, the JavaScript, the MapLibre GL layer configurations, the interactive panel logic and Gemini to refine and pressure-test the prompts that shape it. The process is iterative: write, test, adjust, rebuild.
The result is a web map with multiple interactive scales. Users can explore data at the city level, at the neighbourhood level, at the individual street segment level. They can hover over a hexagonal cell and see its movement density, and they can click on a barangay and read its ecological classification. They can toggle between layers such as tree cover, connectivity clusters, road corridors, core habitat patches, and bird sightings and watch the city's hidden ecological structure become visible in real time. A user can zoom and explore the map just like using popular and common web map platforms like Google Maps.
For the case of the Schools Catchment map, views vary by subject: schools, 15-minute catchments and underserved areas. Schools data are also further detailed, while comparing catchment reach, capacity and enrolees. The latter two is further scaled to the barangay scale, allowing easier identification of area, towards clearer policy inputs that are scaled in such level. Apart from the generative AI platforms, we also explored how existing QGIS plugins such as qgis2web can harmonize with the AI assisted workflows.
In the creation of these web maps, we emphasized on using open platforms in the consideration that this may be replicable for other scientists and aspiring map communicators.

Science communication must be well-intentioned.
In developing the web map platform, we try to identify what layers to put at a time and how they are presented. The included viewing-options and scales are meant to capture how Filipinos often view space (i. e. By barangay or by street); as well as on how to capture complex phenomena through hex grids, rather than pixel rasters that may be confusing or too raw.
UI/UX, labelling, colors and buttons should also be well-considered. Colors must be able to show what must be emphasized, as well as differentiate different layer classifications, all while keeping clarity in the web map.
Apart from the maps themselves, a web map platform allows scientists to show related content that may be otherwise far or unaligned from our research that may be difficult to include in manuscripts or posters. In the case of the green ecological networks, bird information from iNaturalist was also included, to compare peoples’ contributed bird sightings, with the algorithm outputs presented in the web map.
GeoCite: A Call for Map Appreciation, Map Innovation and Scientific Imagination
WTA Labs is launching GeoCite to extend our ways of communicating our map-based research in more interactive and imaginative ways. This is also our way of advancing our advocacy of improving science communication in the country, towards building a platform for research, and influencing more youth to consider the science and planning industries. Scientists, planners and architects must infuse more intent in presenting their works, towards a more intuitive exchange of ideas. It is when we understand more of our cities, environments and communities that allow us to be more engaged and more connected to these spaces that we inhabit; and it is when we need to call further action that we need to engage more people towards collective action.
Access GeoCite at: wtalabs.ph/geocite
Managing these web maps further need inputs from users towards identifying bugs and posing questions that the authors may answer. We invite you to view our web maps, as well as send us questions, comments and suggestions. You may also ping us for any bugs that you detect. Email us at: labs@wta.ph to connect with us!

